Variance Calculator: A Simple Guide for Financial Analysis
Shanzay Arain·Jul 12, 2026
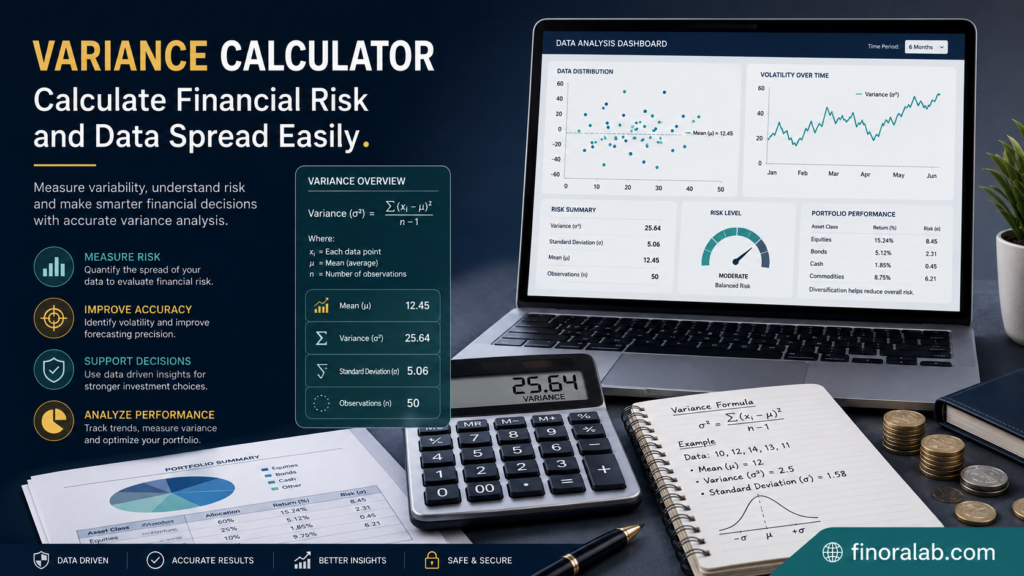
A variance calculator measures how far a group of values is spread out from its average. Although variance is a statistical concept, it has many practical applications in personal finance, investing, budgeting, banking, insurance, and business planning.
For example, two investments might generate the same average annual return but behave very differently. One may produce relatively stable results, while the other experiences sharp gains and losses. Variance helps reveal that difference.
You can also use variance to examine monthly spending, business revenue, insurance claims, loan repayment amounts, stock returns, and other numerical information. A higher variance generally means that the values are more widely dispersed, while a lower variance indicates that they remain closer to the average.
However, variance should not be treated as a complete measure of financial risk. It does not explain why the numbers changed, whether the changes were positive or negative, or what may happen in the future. It is most useful when combined with other financial and statistical measures.
What Is a Variance Calculator?
A variance calculator is a tool that determines the average squared difference between individual data values and the mean of the dataset.
In simpler words, the calculator first finds the average. It then measures how far every value is from that average. Because positive and negative differences could otherwise cancel each other out, each difference is squared before the calculator finds their average.
A variance calculator may calculate either
Population variance, when the dataset represents the complete group being studied
Sample variance, when the dataset represents only part of a larger group
Choosing the correct type is important because population and sample variance use slightly different formulas.
What Does Variance Mean in Finance?
In finance, variance is commonly used to measure the dispersion of investment returns. A stock, fund, or portfolio with highly inconsistent returns will usually have greater variance than one with stable returns.
Variance can also measure inconsistency in
Household expenses
Monthly income
Business sales
Investment performance
Insurance claim values
Credit losses
Loan repayments
Cash flow
Production costs
Forecasting errors
Variance does not automatically mean that something is good or bad. Its interpretation depends on the purpose of the analysis.
Population Variance and Sample Variance
The most important choice when using a variance calculator is deciding whether your numbers represent a population or a sample.
Population Variance
Population variance is appropriate when the dataset includes every value in the group you want to analyze.
For example, suppose you want to measure the variance of your household expenses for every month of the previous year. If you enter all 12 months, those values represent the complete population for that period.
The population variance formula is
σ² = Σ(x − μ)² ÷ N
Where
σ² represents population variance
x represents each value
μ represents the population mean
N represents the total number of values
Σ means the values should be added together
Sample Variance
Sample variance is used when your dataset contains only part of the complete population.
For example, an analyst may use the returns from selected trading days to estimate the behavior of a stock over a much longer period. Because the selected days represent a sample, sample variance may be more appropriate.
The sample variance formula is
s² = Σ(x − x̄)² ÷ (n − 1)
Where
s² represents sample variance
x represents each value
x̄ represents the sample mean
n represents the number of observations
n − 1 provides a statistical adjustment known as Bessels correction
Dividing by n − 1 helps reduce the tendency of a sample to underestimate the variance of the larger population.
Quick Summary Table
Feature
Population Variance
Sample Variance
Best used for
A complete dataset
Part of a larger dataset
Symbol
σ²
s²
Denominator
N
n − 1
Typical finance example
All monthly expenses from one year
Selected historical stock returns
Main purpose
Describe the full group
Estimate the larger population
Units
Squared units
Squared units
Related measure
Population standard deviation
Sample standard deviation
How a Variance Calculator Works
A variance calculator follows a series of mathematical steps. The tool automates these steps, but understanding the process can help you interpret the result correctly.
The calculator
Adds all the values
Divides the total by the number of values to find the mean
Subtracts the mean from each value
Squares each difference
Adds the squared differences
Divides the result by N or n − 1
The final number is the variance.
Practical Investment Return Example
Suppose an investment produced the following monthly returns
2%, −1%, 3%, 0%, and 1%
First, calculate the average return
Mean = (2 − 1 + 3 + 0 + 1) ÷ 5
Mean = 1%
Next, calculate how far each return is from the average
Return
Difference From Mean
Squared Difference
2%
1
1
−1%
−2
4
3%
2
4
0%
−1
1
1%
0
0
The sum of the squared differences is
1 + 4 + 4 + 1 + 0 = 10
If these five months represent the complete period being analyzed, calculate population variance
Population variance = 10 ÷ 5 = 2
If the five months represent a sample used to estimate a longer investment history, calculate sample variance
Sample variance = 10 ÷ 4 = 2.5
The sample variance is slightly higher because the formula divides by n − 1 instead of n.
Variance Versus Standard Deviation
Variance and standard deviation are closely related, but they are not identical.
Variance is expressed in squared units. If investment returns are measured in percentage points, their variance is measured in squared percentage points. If household expenses are measured in dollars, the variance is measured in squared dollars.
Because squared units can be difficult to interpret, analysts often calculate standard deviation by taking the square root of the variance.
The formula is
Standard deviation = √Variance
Using the previous investment example
Population variance 2
Population standard deviation approximately 1.41 percentage points
Sample variance 2.5
Sample standard deviation approximately 1.58 percentage points
Standard deviation is often easier to communicate because it uses the same units as the original data.
Financial Uses of a Variance Calculator
Variance has several applications across personal finance, investing, banking, insurance, and business management.
Measuring Investment Volatility
Investors use variance to examine how widely an assets historical returns moved around its average return.
A larger variance suggests that returns were less consistent. A smaller variance indicates that returns remained closer to their historical average.
However, historical variance does not guarantee future volatility. Economic conditions, company performance, interest rates, market sentiment, liquidity, and unexpected events can change an investments behavior.
Comparing Investment Portfolios
A variance calculator may help compare portfolios that have similar average historical returns.
Suppose Portfolio A and Portfolio B both generated an average return of 7%. Portfolio A may have experienced relatively modest changes, while Portfolio B may have produced several large gains and losses.
Their average returns appear similar, but variance may reveal that Portfolio B experienced substantially greater volatility.
Investors should also consider diversification, fees, liquidity, time horizon, maximum drawdown, correlation, taxes, and personal risk tolerance.
Analyzing Household Expenses
Variance can show whether household spending remains predictable.
You could enter monthly amounts for
Groceries
Electricity
Transportation
Medical costs
Entertainment
Credit card payments
Home maintenance
Low variance may indicate that an expense category is relatively stable. High variance may reveal seasonal spending, irregular bills, emergencies, or weak budgeting controls.
Evaluating Business Performance
Businesses can calculate variance for sales, expenses, profit margins, inventory costs, production output, or cash flow.
A company might compare actual results with budgeted figures to identify areas that require attention. This is related to variance analysis in management accounting, although accounting variance analysis may use different formulas depending on the metric.
Assessing Insurance and Banking Data
Insurance analysts may study the variance of claim amounts to understand how widely losses differ from the average claim.
Banks and lenders may use statistical models involving variance to analyze payment behavior, credit losses, defaults, and other financial outcomes. These decisions normally require more advanced risk models than a basic online variance calculator.
Reviewing Income Stability
Freelancers, business owners, and commission based workers can use variance to assess income consistency.
High monthly income variance may indicate a need for
A larger emergency fund
More conservative fixed expenses
Separate tax savings
Flexible monthly budgeting
Cash flow forecasting
Variance does not measure total wealth or financial health, but it can help identify instability.
Benefits and Risks of Using a Variance Calculator
A variance calculator can simplify financial analysis, but its output must be interpreted carefully.
Benefits
Fast calculations A calculator can process large datasets more quickly than manual calculations.
Improved accuracy Automated calculation reduces arithmetic mistakes when the values are entered correctly.
Better comparisons Variance helps compare the consistency of multiple investments, budgets, or business results.
Useful risk indicator In investing, variance provides one measure of historical volatility.
Budgeting insights It can identify spending or income categories with significant fluctuations.
Supports forecasting Businesses may use historical variance when creating assumptions and financial models.
Easy access Many spreadsheet programs, statistical platforms, and online calculators include variance functions.
Risks and Limitations
It treats positive and negative changes similarly A large gain and a large loss both increase variance because their differences are squared.
Historical results may not continue Past investment variance does not predict future returns or risk with certainty.
Outliers can distort the result One unusually high or low value may significantly increase variance.
Incorrect formula selection causes errors Using population variance instead of sample variance, or vice versa, changes the result.
Variance uses squared units The final number may be difficult for beginners to interpret without calculating standard deviation.
Data quality matters Missing, duplicated, inaccurate, or selectively chosen values can produce a misleading result.
Variance is not complete financial advice It does not account for debt, liquidity, inflation, taxes, fees, investment goals, or personal risk tolerance.
Step by Step Guide to Using a Variance Calculator
Follow this process when calculating variance for financial data.
Define the Purpose
Determine what you are trying to measure.
Examples include
Monthly investment returns
Weekly household spending
Annual business revenue
Insurance claim amounts
Loan payment values
Budget forecasting errors
A clearly defined purpose makes it easier to choose suitable data.
Collect Consistent Data
Use values measured over comparable periods and in the same units.
Do not mix monthly returns with annual returns or combine dollar values with percentages in the same calculation.
Clean the Dataset
Check for
Missing values
Duplicate entries
Typing mistakes
Incorrect negative signs
Different currencies
Inconsistent time periods
Extreme outliers
Do not automatically remove an outlier merely because it is unusual. First determine whether it represents a valid event or a data error.
Choose Sample or Population Variance
Select population variance when the dataset includes the full group you want to describe.
Select sample variance when the numbers are being used to estimate the behavior of a larger group.
Enter the Values
Enter each number according to the calculators instructions. Some calculators accept commas, spaces, separate rows, or uploaded spreadsheet files.
For percentage returns, check whether the calculator expects
Whole percentages, such as 5 for 5%
Decimals, such as 0.05 for 5%
Using the wrong format may produce a result that is mathematically correct but displayed at an unexpected scale.
Review the Mean and Variance
A useful calculator should show the mean along with the variance. Review both numbers because variance is calculated in relation to the mean.
Calculate Standard Deviation
Take the square root of the variance when you need a result expressed in the original unit.
Standard deviation is often more practical when explaining investment volatility, income variation, or spending consistency.
Interpret the Result in Context
Do not label a variance as high or low without a comparison.
Compare it with
Previous periods
A financial target
A suitable benchmark
Another investment
A similar expense category
An industry standard
A risk tolerance threshold
The meaning of a variance depends on the dataset and the decision being made.
How to Use Variance in Budgeting
Variance can help identify unpredictable areas in a personal budget.
For example, suppose a household spends an average of $500 per month on groceries. The average alone does not show whether monthly spending is usually close to $500 or ranges between $250 and $750.
Variance provides additional information about the consistency of those expenses.
A budgeting review may include
Average monthly expense
Variance
Standard deviation
Highest monthly expense
Lowest monthly expense
Number of months above budget
Reasons for major fluctuations
The goal should not always be to eliminate variance. Some expenses naturally change because of seasons, emergencies, travel, school costs, healthcare needs, or annual payments.
How to Use Variance in Investing
In investment analysis, variance commonly describes the historical dispersion of returns around the average return.
An asset with higher variance has shown greater fluctuations during the measured period. This may suggest greater uncertainty, but variance should not be used alone to select or reject an investment.
Consider pairing it with
Standard deviation
Average return
Maximum drawdown
Sharpe ratio
Beta
Correlation
Asset allocation
Expense ratio
Investment time horizon
Liquidity
Tax consequences
A lower variance investment is not automatically better. It may also offer lower growth potential, have inflation risk, or fail to match the investors long term objectives.
Similarly, a high variance asset is not automatically unsuitable. Its appropriateness depends on portfolio allocation, diversification, financial capacity, goals, and risk tolerance.
Variance and Portfolio Diversification
Portfolio variance is more complicated than calculating variance for one list of returns.
The volatility of a portfolio depends on
The variance of each asset
The amount invested in each asset
The correlation or covariance between assets
Combining two volatile investments does not always create an equally volatile portfolio. If the investments do not move in the same direction at the same time, diversification may reduce total portfolio variance.
A basic variance calculator can analyze an individual dataset, but calculating portfolio variance generally requires asset weights and covariance data.
Investors evaluating a portfolio should use an appropriate portfolio analysis tool or seek guidance from a qualified financial professional.
Common Mistakes to Avoid
Selecting the Wrong Variance Type
Using population variance for a sample may underestimate the variance of the larger population.
Before calculating, decide whether your values represent the complete group or only a portion of it.
Confusing Variance With a Budget Difference
In everyday financial language, variance can also mean the difference between an actual amount and a planned amount.
For example
Budget variance = Actual spending − Budgeted spending
This is different from statistical variance, which measures the average squared distance from the mean.
Mixing Percentages and Decimals
Entering 5 for one return and 0.05 for another creates an inconsistent dataset.
Choose one format and apply it to every value.
Comparing Different Time Periods
Daily stock return variance should not be directly compared with annual return variance without an appropriate statistical conversion.
Similarly, monthly household expenses should not be mixed with weekly figures.
Ignoring Outliers
Extreme values may dramatically affect variance.
Investigate the reason for an outlier instead of automatically deleting it or accepting it without review.
Treating High Variance as Proof of Loss
Variance measures dispersion, not direction.
Large positive returns can increase variance just as large negative returns do.
Assuming Low Variance Means No Risk
An investment can have low historical variance and still face inflation, credit, liquidity, interest rate, regulatory, or business risk.
Using Too Little Data
A very small dataset may produce an unstable result that does not represent normal financial behavior.
Use a meaningful time period and enough observations for the purpose of the analysis.
Relying on a Calculator Without Checking Its Formula
Some calculators default to sample variance, while others use population variance.
Always confirm which denominator the tool uses.
Latest Update
Unlike tax brackets, interest rates, lending rules, stock prices, or cryptocurrency prices, the mathematical formulas used by a variance calculator do not change according to current market conditions or financial regulations.
The most important current consideration is the quality and security of the tool being used. Before uploading financial records, bank statements, customer information, or investment data, review the calculators privacy practices and data storage policy.
For sensitive information, consider using a trusted offline spreadsheet or financial analysis application rather than entering private data into an unknown website.
When variance is applied to current investments, interest rates, market prices, tax decisions, or regulated financial products, verify all related information through recent and reliable sources. Variance calculations based on outdated prices or incomplete records may not reflect present conditions.
Expert Tips for Better Financial Analysis
Calculate Both Variance and Standard Deviation
Variance is useful for mathematical analysis, while standard deviation is usually easier to interpret.
Looking at both provides a more complete understanding of the dataset.
Use a Relevant Benchmark
A variance result becomes more meaningful when compared with a previous period, a similar investment, a budget target, or a suitable market benchmark.
Avoid comparing unrelated datasets.
Keep the Data Frequency Consistent
Use daily data with daily data and monthly data with monthly data.
Consistency improves the reliability of comparisons.
Review the Mean Carefully
Variance measures dispersion around the mean. If the mean itself is distorted by outliers, the variance may also be difficult to interpret.
Consider reviewing the median and range when the dataset is highly skewed.
Separate Expected and Unexpected Changes
A high expense variance may result from predictable seasonal bills rather than poor money management.
Add notes to unusual financial periods so that the numbers can be interpreted correctly.
Protect Private Financial Information
Avoid uploading account numbers, customer names, Social Security numbers, tax identification numbers, card information, or confidential business records to an unfamiliar online calculator.
Use anonymized or aggregated values whenever possible.
Do Not Make Decisions From One Metric
For investment decisions, evaluate risk, return, fees, diversification, liquidity, taxes, and personal goals.
For budgeting decisions, evaluate cash flow, debt obligations, savings targets, and emergency reserves.
Variance should support a financial decision, not make the decision by itself.
Conclusion
A variance calculator is a useful tool for measuring how widely financial values are spread around their average. It can help analyze investment returns, household expenses, income stability, business revenue, insurance data, and other numerical information.The most important step is choosing between population and sample variance. Users should also remember that variance is expressed in squared units, which is why standard deviation is often easier to interpret.While variance can reveal financial volatility or inconsistency, it cannot explain every type of risk or predict future outcomes. Use it alongside reliable data, suitable benchmarks, and other financial measures.
FAQs
What is a variance calculator?
A variance calculator is a statistical tool that measures how widely a group of values is spread around its average. It calculates the squared differences between each value and the mean and then averages those differences.
What is the difference between sample and population variance?
Population variance describes a complete dataset and divides the sum of squared differences by N. Sample variance estimates a larger population from a smaller sample and divides by n − 1.
How is variance used in finance?
Variance is used to evaluate the dispersion of investment returns, expenses, income, revenue, insurance claims, credit losses, and other financial values. In investing, it is commonly associated with historical volatility.
Does high variance mean an investment will lose money?
No. High variance means that historical returns were widely spread around their average. Both large gains and large losses can increase variance. It does not predict whether an investment will rise or fall.
Is lower variance always better?
Not necessarily. Lower variance may indicate greater consistency, but it does not account for inflation risk, credit risk, liquidity, expected returns, fees, or an investors goals. The result must be interpreted in context.
Why is variance expressed in squared units?
The differences from the mean are squared to prevent positive and negative differences from canceling each other out. As a result, variance is expressed in squared units. Standard deviation converts the result back to the original unit.
Can I calculate variance in a spreadsheet?
Yes. Most spreadsheet applications provide separate functions for sample and population variance. Before using a function, confirm whether it calculates sample variance or population variance and ensure the dataset is formatted consistently.
I am a professional finance content writer with expertise in personal finance investing, banking, loans, insurance, credit cards, budgeting, and market related topics. I create clear, SEO optimized, and reader friendly finance content that helps audiences understand complex financial concepts in simple words. My goal is to write trustworthy and engaging content that improves search visibility, builds credibility, and supports business growth.
I am a professional finance content writer with expertise in personal finance investing, banking, loans, insurance, credit cards, budgeting, and market related topics. I create clear, SEO optimized, and reader friendly finance content that helps audiences understand complex financial concepts in simple words. My goal is to write trustworthy and engaging content that improves search visibility, builds credibility, and supports business growth.