
In modern finance investing business analysis and data science numbers alone are not enough. Understanding how numbers fluctuate and spread over time is equally important. This is where a Variance Calculator becomes an essential tool for students investors analysts business owners and researchers.
Whether you are analyzing stock market returns evaluating business performance comparing investment risks or studying statistical data variance helps measure how far values are spread from the average. A variance calculator simplifies this process by instantly calculating data variability without requiring complex manual calculations.
Today’s financial and business world relies heavily on data-driven decisions. Investors study market volatility businesses track performance consistency and analysts compare financial risks using variance and related statistical tools. Without understanding variance it becomes difficult to measure uncertainty stability or performance trends accurately.
This detailed guide from FinoraLab explains how a Variance Calculator works why variance matters in finance and statistics how formulas are used practical examples advantages limitations and real-world applications.
Key Takeaways
- A Variance Calculator measures how spread out numbers are from their average value.
- Variance is widely used in finance investing economics business analytics and statistics.
- Higher variance indicates greater variability and risk.
- Online variance calculators simplify complex mathematical calculations.
- Investors use variance to evaluate market volatility and portfolio risk.
- Related financial tools like ROI Calculator Compound Interest Calculator SIP Calculator and Tax Calculator support broader financial analysis.

What Is Variance?
Variance is a statistical measurement that shows how far individual numbers in a dataset differ from the mean or average.
In simple terms variance tells us whether data points are closely grouped together or widely spread apart.
For example:
- Low variance means numbers stay relatively close to the average.
- High variance means numbers fluctuate significantly.
Variance is commonly used in:
- Finance
- Stock market analysis
- Economics
- Business forecasting
- Scientific research
- Data analytics
- Risk management
A Variance Calculator automates the entire process making it easier to analyze datasets quickly and accurately.
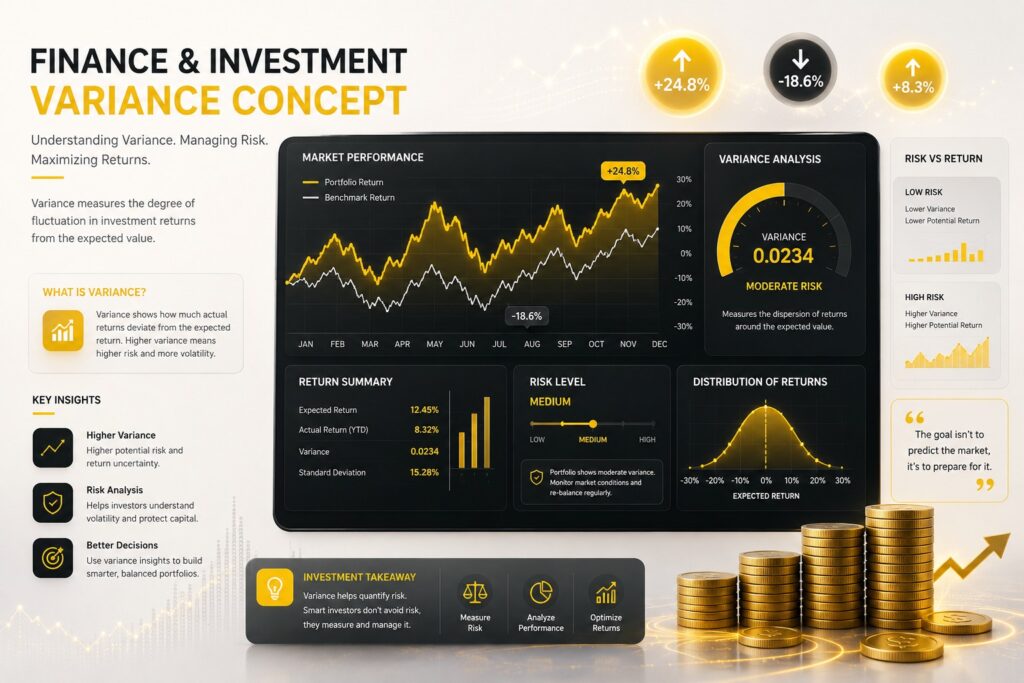
Why Variance Matters in Finance
In finance variance plays a critical role because it measures risk and volatility.
Investors want to understand how stable or unpredictable an investment may be. Stocks with high variance tend to experience larger price swings while low-variance assets are generally more stable.
For example:
| Investment Type | Variance Level | Risk |
| Government bonds | Low | Lower |
| Blue-chip stocks | Moderate | Medium |
| Growth stocks | High | Higher |
| Cryptocurrency | Very High | Extremely High |
Understanding variance helps investors balance their portfolios and make informed decisions.
What Does a Variance Calculator Do?
A Variance Calculator automatically computes the variance of a dataset using statistical formulas.
Instead of manually solving equations users simply enter data values and the calculator provides instant results.
Most variance calculators can determine:
- Population variance
- Sample variance
- Mean value
- Standard deviation
- Data spread
These tools are useful for students investors business analysts accountants and researchers.
Understanding the Variance Formula
The standard population variance formula is:
\sigma^2 = \frac{\sum (x – \mu)^2}{N}
Here is what each symbol means:
| Symbol | Meaning |
| σ² | Population variance |
| x | Individual data value |
| μ | Mean or average |
| N | Total number of values |
This formula measures the average squared distance between each value and the mean.
Sample Variance Formula
For sample data the formula changes slightly:
genui{“math_block_widget_always_prefetch_v2”:{“content”:”s^2 = \frac{\sum (x – \bar{x})^2}{n-1}”}}
Where:
| Symbol | Meaning |
| s² | Sample variance |
| x̄ | Sample mean |
| n | Number of sample values |
The subtraction of 1 helps improve accuracy when estimating population variance from a sample.
Step-by-Step Example of Variance Calculation
Suppose a student receives these test scores:
- 70
- 75
- 80
- 85
- 90
Step 1: Find the Mean
\bar{x} = \frac{70+75+80+85+90}{5}
Mean = 80
Step 2: Subtract Mean From Each Value
| Value | Difference From Mean |
| 70 | -10 |
| 75 | -5 |
| 80 | 0 |
| 85 | 5 |
| 90 | 10 |
Step 3: Square Each Difference
| Difference | Squared Value |
| -10 | 100 |
| -5 | 25 |
| 0 | 0 |
| 5 | 25 |
| 10 | 100 |
Step 4: Add Squared Values
Total = 250
Step 5: Divide by Number of Values
\sigma^2 = \frac{250}{5}
Variance = 50
A Variance Calculator performs these calculations instantly saving time and reducing human error.
Difference Between Variance and Standard Deviation
Variance and standard deviation are closely related but not identical.
| Feature | Variance | Standard Deviation |
| Measures spread | Yes | Yes |
| Uses squared values | Yes | No |
| Easier to interpret | Less | More |
| Common in finance | Yes | Yes |
Standard deviation is simply the square root of variance.
Formula:
\sigma = \sqrt{\sigma^2}
Because standard deviation uses original units instead of squared values many analysts find it easier to interpret.
Population Variance vs Sample Variance
Understanding this distinction is important when using a Variance Calculator.
Population Variance
Used when analyzing an entire dataset.
Example:
- Calculating variance for all employees in a company.
Sample Variance
Used when analyzing only a portion of a larger group.
Example:
- Surveying 100 customers from a population of 10000 customers.
Most real-world financial studies use sample variance because collecting complete population data is often impractical.
Why Investors Use Variance Calculators
Variance is widely used in investing because it measures market volatility.
Investors analyze variance to:
- Assess portfolio risk
- Compare investment stability
- Evaluate stock performance
- Improve diversification
- Understand market behavior
A portfolio with extremely high variance may generate larger profits but also carries greater risk.
Real-World Example in Stock Investing
Imagine two investment funds:
| Fund | Average Return | Variance |
| Fund A | 8% | Low |
| Fund B | 8% | High |
Although both funds produce the same average return Fund B experiences larger fluctuations.
Some years it may gain 20% while other years it may lose 15%.
Investors who prefer stability may choose Fund A because of its lower variance.
Variance in Business and Economics
Variance is not limited to investing.
Businesses use variance analysis to compare expected performance with actual results.
Examples include:
- Budget variance
- Revenue variance
- Expense variance
- Production variance
- Sales variance
For example if a company expected monthly sales of $50000 but actual sales reached $65000 managers analyze the variance to understand the difference.
This helps businesses improve planning and forecasting.
How Online Variance Calculators Simplify Analysis
Manual variance calculations become difficult with large datasets.
Online calculators simplify the process by:
- Eliminating manual errors
- Providing instant results
- Supporting large datasets
- Saving time
- Improving financial analysis
Most modern calculators also display:
- Mean
- Median
- Standard deviation
- Data distribution
This makes them valuable for both beginners and professionals.
Common Mistakes When Calculating Variance
Forgetting to Square Differences
Variance calculations require squaring each difference from the mean.
Confusing Sample and Population Variance
Using the wrong formula can produce inaccurate results.
Ignoring Outliers
Extreme values can significantly increase variance.
Misinterpreting High Variance
High variance does not always mean bad performance. In finance higher returns often involve greater volatility.
Relying Only on Variance
Variance should be used alongside other financial indicators rather than alone.
Variance and Portfolio Diversification
Diversification is one of the most important investing principles.
By combining different asset classes investors can reduce overall portfolio variance.
For example:
- Stocks
- Bonds
- Real estate
- Commodities
- Cash investments
When one asset declines another may remain stable or rise.
This reduces total investment volatility and improves long-term risk management.
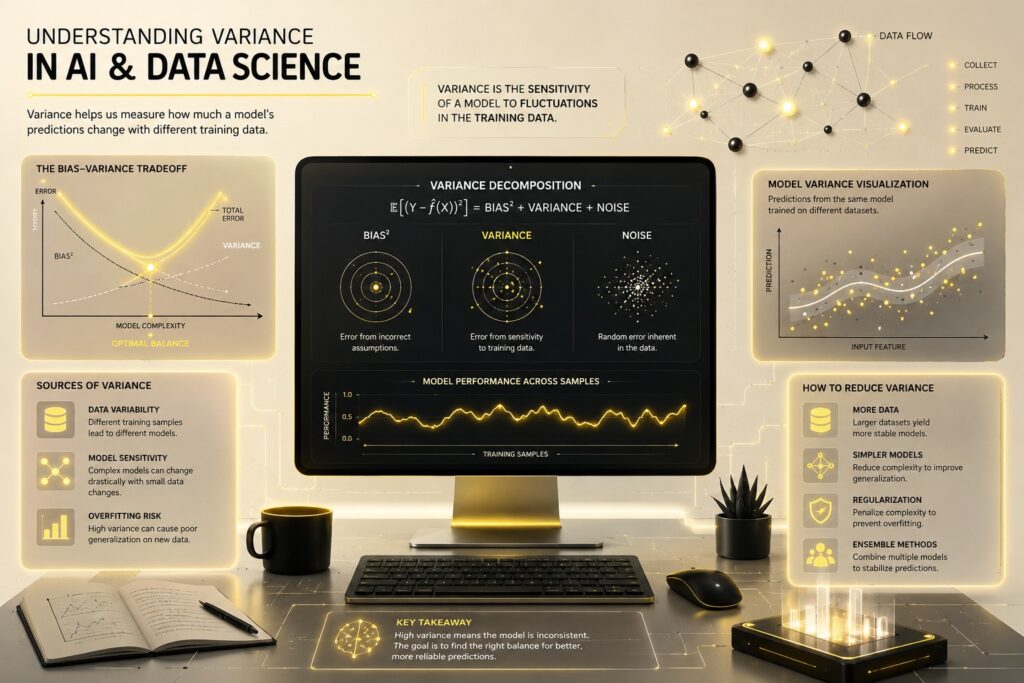
Variance in Modern Financial Technology
Today’s financial software heavily relies on variance calculations.
Modern platforms use variance in:
- Algorithmic trading
- Risk management systems
- AI investment tools
- Portfolio optimization
- Financial forecasting
Variance analysis has become a core component of data-driven investing.
Advantages of Using a Variance Calculator
Fast Calculations
Large datasets can be analyzed within seconds.
Improved Accuracy
Automated tools reduce human calculation mistakes.
Better Financial Decision-Making
Variance helps users understand uncertainty and risk.
Useful Across Multiple Industries
Variance is valuable in finance education science economics and business.
Beginner-Friendly
Most online calculators are easy to use without advanced mathematical knowledge.
Limitations of Variance
Although useful variance has some limitations.
Difficult Interpretation
Squared units may be harder to understand compared to standard deviation.
Sensitive to Outliers
Extreme values can distort results significantly.
Does Not Explain Direction
Variance measures spread but not whether values move upward or downward.
Requires Additional Metrics
Financial analysts usually combine variance with other indicators for deeper analysis.

Variance Calculator vs Other Financial Tools
Variance calculators work alongside many financial planning tools.
ROI Calculator
Measures profitability and investment efficiency.
Compound Interest Calculator
Shows long-term growth from reinvested earnings.
SIP Calculator
Helps estimate systematic investment plan returns.
EMI Calculator
Calculates monthly loan payments.
Loan Calculator
Analyzes borrowing costs and repayment schedules.
Tax Calculator
Estimates tax liabilities and after-tax returns.
Together these tools create a stronger financial planning framework.
Real-World Applications of Variance
Variance is used in many industries and real-life situations.
Stock Market Analysis
Investors measure stock volatility and market risk.
Banking
Banks evaluate lending risks and customer credit behavior.
Education
Teachers analyze student performance consistency.
Manufacturing
Companies monitor production quality and cost fluctuations.
Scientific Research
Researchers study experimental reliability and accuracy.
Sports Analytics
Teams analyze player performance variations.
Historical Importance of Variance
Variance has been an important concept in statistics for centuries.
It became especially influential in finance during the development of modern portfolio theory by economist Harry Markowitz.
Markowitz demonstrated how diversification could reduce portfolio variance and improve investment efficiency.
Today variance remains a foundational concept in financial risk management worldwide.
Why Variance Matters for Beginners
Beginners often focus only on profits while ignoring volatility.
However understanding risk is just as important as understanding returns.
For example:
- Two investments may produce identical average profits.
- One investment may fluctuate dramatically while the other remains stable.
Variance helps investors identify these differences clearly.
Learning variance improves financial literacy and decision-making confidence.
The Future of Variance Analysis
As artificial intelligence and big data continue evolving variance analysis will become even more advanced.
Future tools may include:
- AI-based predictive variance modeling
- Real-time market volatility tracking
- Automated portfolio balancing
- Personalized financial risk analysis
- Advanced investment simulations
These innovations could make financial planning smarter and more accessible for everyone.
Conclusion
A Variance Calculator is far more than a mathematical tool. It is a practical resource for understanding risk volatility consistency and data behavior across finance investing business and statistics.
Whether you are analyzing stock market performance measuring business efficiency studying academic data or managing investment portfolios variance provides valuable insights into how data fluctuates over time.
By simplifying complex calculations variance calculators help beginners and professionals make more informed decisions with greater confidence. When combined with tools like ROI Calculators SIP Calculators Compound Interest Calculators and Tax Calculators variance analysis becomes part of a complete financial planning strategy.
At FinoraLab understanding financial data is not just about tracking numbers. It is about making smarter decisions reducing uncertainty and building long-term financial confidence in an increasingly data-driven world.
FAQs
What is a Variance Calculator?
A Variance Calculator is a tool that measures how spread out numbers are from their average value.
Why is variance important in finance?
Variance helps investors measure market volatility and investment risk.
What does high variance mean?
High variance indicates that values fluctuate significantly from the average.
What is the difference between variance and standard deviation?
Variance measures squared deviations from the mean while standard deviation is the square root of variance.
Can beginners use a Variance Calculator?
Yes. Most online calculators are simple and beginner-friendly.
Is variance used in stock market analysis?
Yes. Investors use variance to evaluate portfolio volatility and investment stability.
What industries use variance analysis?
Finance banking education manufacturing science and business analytics commonly use variance analysis.
Does variance predict future results?
No. Variance measures historical data spread and volatility but does not guarantee future outcomes.
I am a professional web developer with strong expertise in digital marketing, SEO, and content writing. I specialize in building modern, responsive, and user-friendly websites that deliver performance and results. Along with development skills, I have a deep understanding of search engine optimization strategies and online marketing techniques that help businesses grow their online presence. My goal is to create impactful digital solutions that combine creativity, functionality, and visibility for better user engagement and business success.


Amazing